Metal Detector Research
The metal detector set up is based on Bell’s 1881 model and mimics the design of a Wheatstone bridge which is shown below.
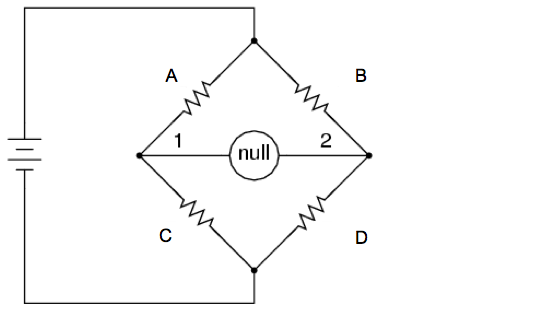
The Wheatstone bridge configuration was designed to precisely measure the resistance of an unknown resistor. If the other three resistors were known to have the same resistance, the amount of current through the middle of the bridge can be measured and using ohms law, the unknown resistance can be determined. For our metal detector, the resistors are replaced with inductors and the coils are labeled as shown above. When the inductor’s impedances are balanced, no current should flow through the middle bridge. Since the metal detector is connected to an AC power source the impedance of an inductor will change when metal is brought in close proximity and current will flow though the bridge. In our metal detector, speakers are attached across the bridge and will sound when current goes through the bridge.
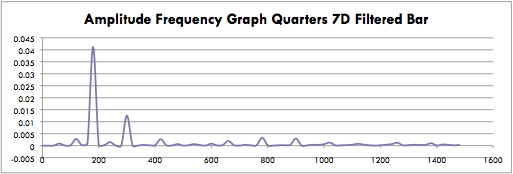
As the summer progressed, and we had sufficiently played around with the computer oscilloscope hooked up to the metal detector, questions arose as to what happens to the frequency across the bridge when different coins are placed into the coils. The oscilloscope is set up across the bridge and ideally no current will flow across in the absence of metal if the inductors are truly balanced. However, the detector is not very precise and background noise, or AC current, across the bridge is present even in the absence of metal. The frequency of the AC current is 60 hertz and if current is going through the bridge then one would expect this frequency as well as its harmonics. Consistently throughout all the data the n120 harmonics are not present. When I collected data, I took a blank data set without any coins and subtracted out the background noise. I used the excel readouts produced from the program of frequency versus Fourier amplitude to make graphs and make comparisons of amplitudes between coins, coils and different computers. An example graph is shown below of the frequency of the higher harmonics when seven quarters are placed in coil D:
Frequency (hertz) vs. Fourier amplitude
Data was taken using four condition:
-
1.Standard oscilloscope with no variation except the presence of coins (Unfiltered, No Bar)
-
2.Standard oscilloscope with a metal bar on coil C to bring the detector more into balance (Unfiltered, Bar)
-
3.Using the oscilloscope’s high pass filter at 100 hertz to cancel out the main 60 hertz frequency (Filtered, No Bar)
-
4.Using the oscilloscope’s high pass filter along with the metal bar on coil C ( Filtered, Bar)
The data was collected from coils
The data collected, especially in graphs subtracting out the blank conditions, showed how the frequency of the current across the bridge changes. For the example of the quarters with a bar on coil c and using a high pass the filter, the changes in frequency are noticeable. Data is from seven quarters in coils D and B.
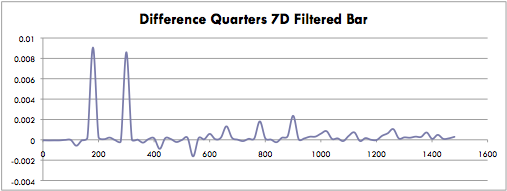
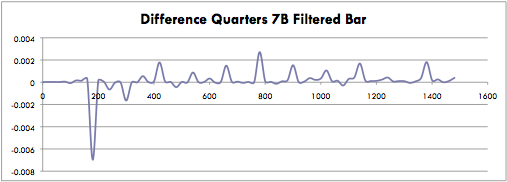
The graphs show the Fourier amplitude of the bar, filtered frequency minus the blank of the same conditions. The quarters in coil D are increasing the 180 hz and 300 hz frequency amplitude. If the metal detector was connected up to speakers instead of the oscilloscope the noise from the speakers would increase when quarters are placed near coil D. In contrast, if quarters are placed near coil B the frequency is decreased, meaning the sound from the speakers would decrease. These graphs were also made for nickels, dimes and pennies for all four conditions.
Unfortunately, there were some issues with the reliability of the computer oscilloscope. Firstly, there was substantial difference between the shape of the frequency wave between the two computers. One computer was thought to have a capacitor in the sound card which distorted the wave as shown below:
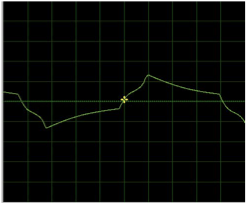
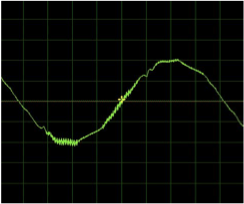
Computer #1 ( capacitor effect) Computer #2
Secondly, the blank data was fairly inconsistent. After the first two data collections, I took a blank data set before each new coin but even then there were several points in the graph where the blank was subtracted out that showed a difference that might be attributed to blank error, or a significant change in the blank conditions. An example of this occurred in data from 7 quarters in coil D from a trial without a bar and where the frequency was unfiltered.
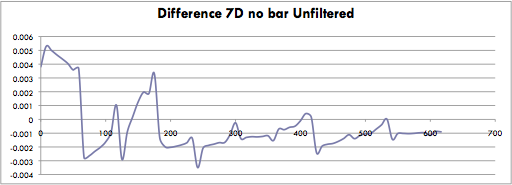
Frequency (Hertz) Vs. Difference in Fourier amplitude
This graph shows a difference peak at 180 and 60 hertz which is to be expected. However the difference at very low frequencies detracts and discredits the expected frequency peaks.