Modifying a Mach-Zehnder Interferometer to Have an Active Delay Stage for Noise Reduction
Jack Massar, Oklahoma State University, Physics Major with minors in architectural studies, music, and mathematics
Mentored by Dr. Meng Han
The attosecond laser group works with extremely short laser pulses on the scale of attoseconds. This allows them to measure the dynamics of electrons and the structural properties of atomic orbitals. Due to the small scale of time they are working with, noise from a large number of sources including but not limited to humidity changes, temperature fluctuations, and mechanical vibrations can affect the beamline and subsequently the pulses. This can lead to a “jitter” in the time delay of roughly 50 attoseconds. Jitters like this can reduce clarity in the measurements taken and lead to less accurate final results.
The current beamline setup being used by Dr. Meng Han’s group uses only passive stabilization on their laser. This is the stabilization achieved with no movement, just the placement and adjustment of the components in the beamline. To reduce jitter below the current level, an active stabilization stage, or a stage with movement, is necessary. My project was to set up a Mach-Zehnder (setup pictured in Figure 1) interferometer to adjust itself based on the laser passing through it. This interferometer setup allows an arm to be adjusted by a piezoelectric motor to reduce the jitter in the laser pulse that passes through the device.
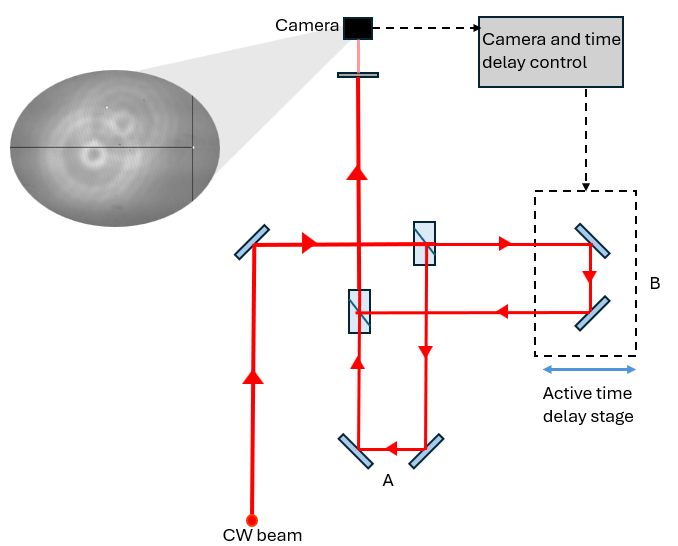
Fig. 1. Diagram of the interferometer setup and movement used in this project.
The interferometer design allows a continuous-wave laser to interfere with itself. This interference pattern (pictured in Figure 2) provides information on the phase of the beam, which can be used to adjust the motor. I designed a program that took continuous images of the interference pattern and found the waveform and subsequent phase of each image (pictured in Figure 3). This program then utilized a Proportional-integral-derivative (or PID) control to compare the measured phase to a set phase and move the motor to match the two values to one another. This program works in a cycle, so after the movement a new image would be taken and the process would start again. The movement of the arm is performed by a small piezoelectric motor and happens on the scale of micrometers and is not visible to the human eye, which keeps the phase much more stable outside factors affect the setup.
To test how well the delay stage program worked, it was tested in two ways: short term runs and long-term runs. The short term run, done over the course of 30 minutes, resulted in a much more stable phase with less deviations than the passive setup (see Figure 4). Similarly, longer runs of two hours and three hours had larger phase variations in the passive setup than the actively stabilized design (see Figures 5 and 6).
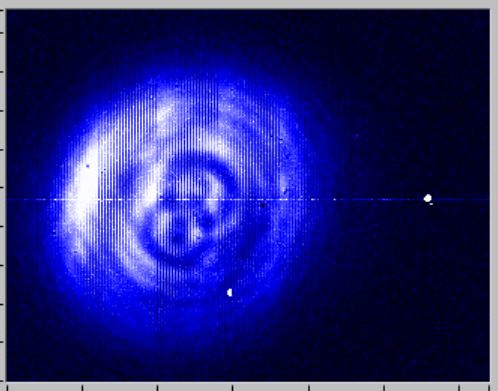
Fig. 2. Intensity graph for the interference fringe ranging from the lowest brightness at 0 (black) to the highest at 250 (white).
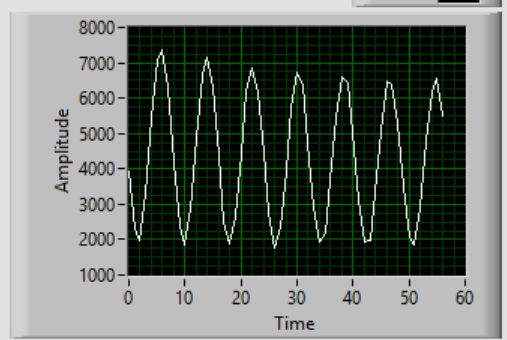
Fig. 3. Waveform obtained from a small portion of the interference fringe.
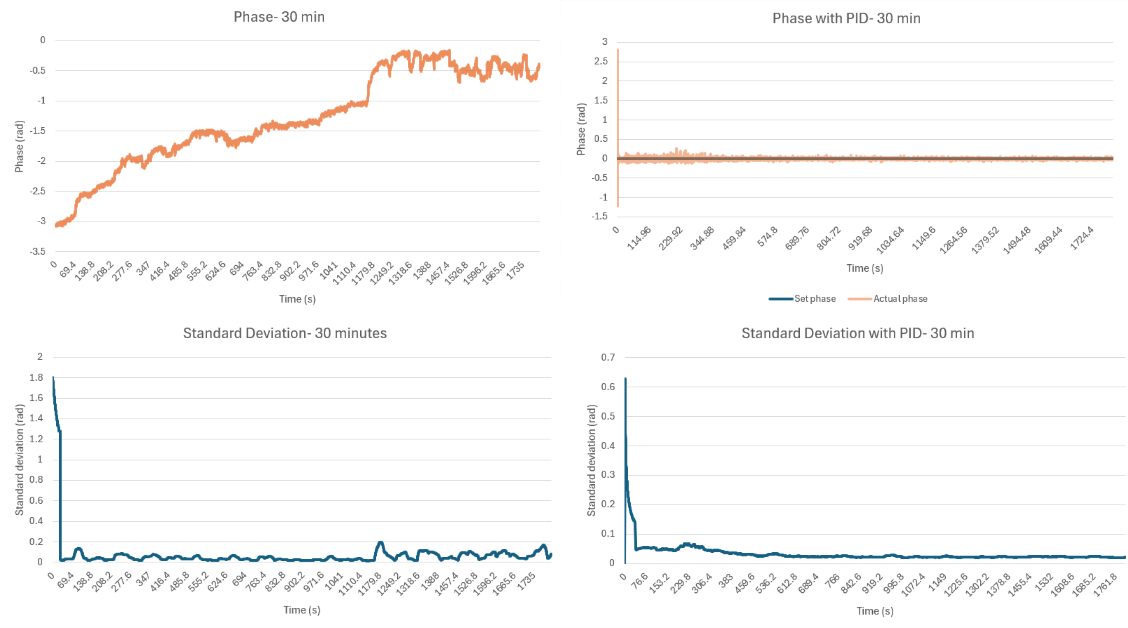
Fig. 4. A comparison between passive and active stabilization for the laser phase and standard deviation of the phase over the course of thirty minutes.
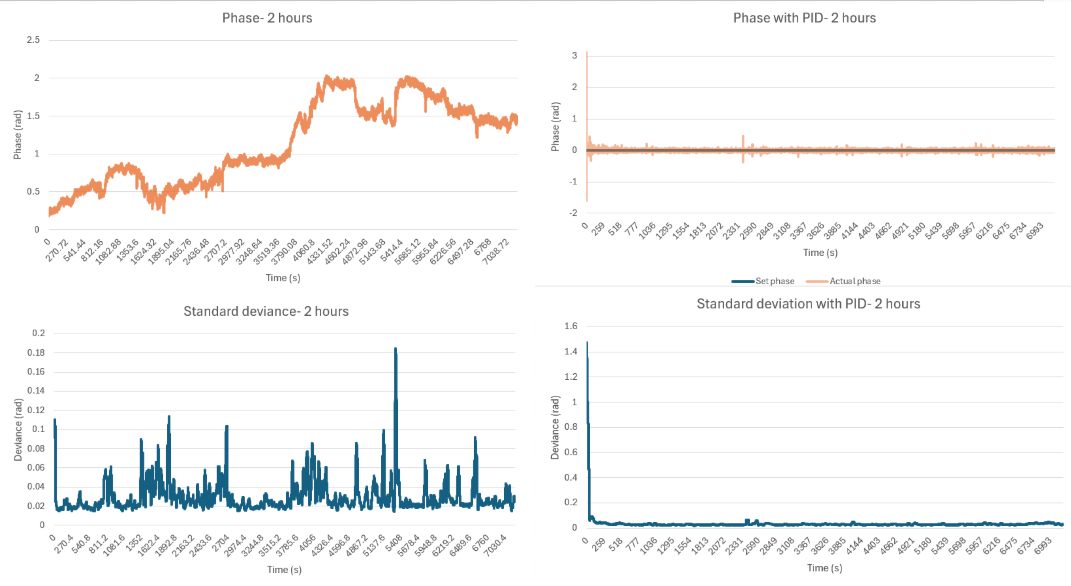
Fig. 5. A comparison between passive and active stabilization for the laser phase and standard deviation of the phase over the course of two hours.
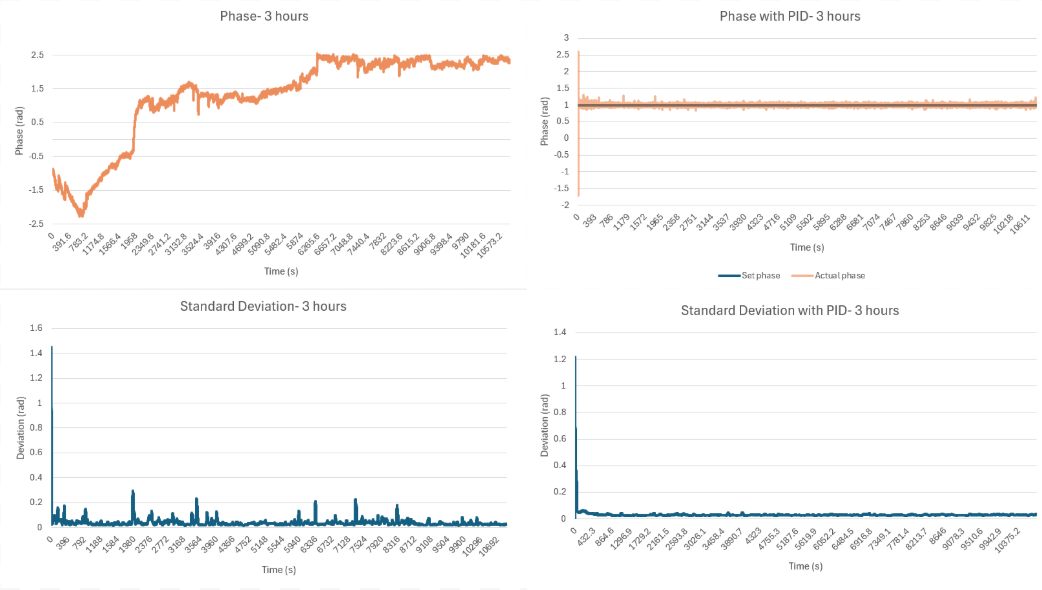
Fig. 6. A comparison between passive and active stabilization for the laser phase and standard deviation of the phase over the course of three hours.
To determine the jitter reduction, the standard deviation measurements were put into a distribution curve to determine the most common deviation of phase. When only passive stabilization was used, the distribution was much wider, producing a non-gaussian shape (see Figure 7). Alternatively, with active stabilization, this distribution was gaussian, with a clear peak (see Figure 8).
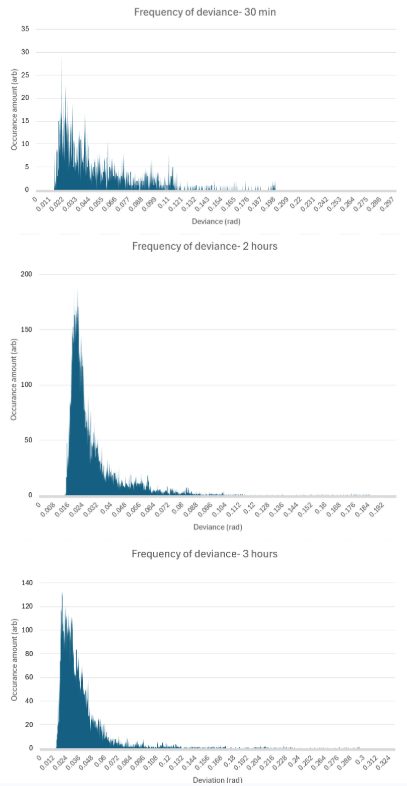
Fig. 7. The distributions of the standard deviations for the thirty minute, two hour, and three hour tests with only passive stabilization.
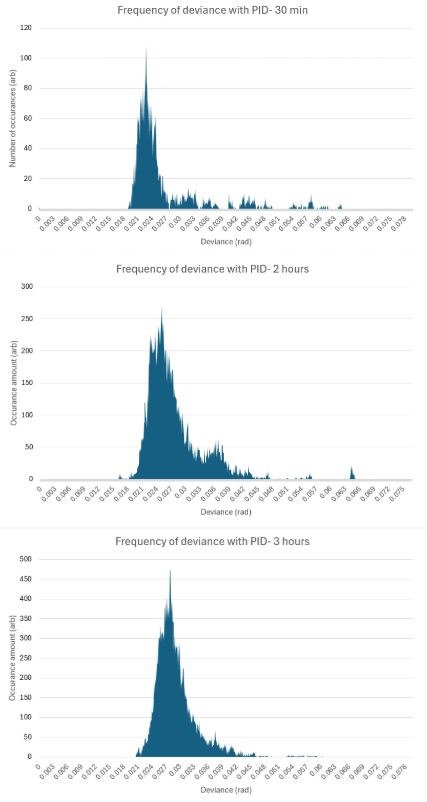
Fig. 8. The distributions of the standard deviations for the thirty minute, two hour, and three hour tests with active stabilization. Note the change in the y scale between Figure 7 and Figure 8.
This peak was taken as the standard deviation value and used to determine the jitter with the formula shown in the equation below:
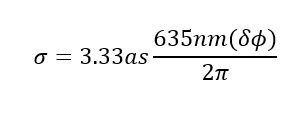 All of the actively stabilized measurements resulted in a jitter below 10 as, which is significantly smaller than the current setup. The setup and programming designed in this program will be integrated into the attosecond laser beamline to allow for more accurate measurements.
References
[1] Chini, M., Mashiko, H., Wang, H., Chen, S., Yun, C., Scott, S., Gilbertson, S., & Chang, Z. Delay control in attosecond pump-probe experiments. [Journal Name], [Volume]([Issue]), [Page numbers]. https://doi.org/[DOI]
[2] Koll, L.-M., Maikowski, L., Drescher, L., Vrakking, M. J. J., & Witting, T. Phase-locking of time-delayed attosecond XUV pulse pairs. [Journal Name], [Volume]([Issue]), [Page numbers]. https://doi.org/[DOI]
Acknowledgments
Thank you to Bret Flanders, Cosmin Blaga, and Kim Coy for support and mentoring during this program. Also, thank you to my mentor Meng Han and his lab group for the resources, time, and information needed to complete this project. Finally, thank you to the REU cohort for the good experience and support.
The experimental equipment was partially supported by the U.S. National Science Foundation through a Faculty Early Career Development (CAREER) Award (No. 2543157).
This material is based upon work supported by the National Science Foundation under Grant No. 2548403. Any opinions, findings, and conclusions or recommendations expressed in this material are those of the author(s) and do not necessarily reflect the views of the National Science Foundation.