Physics Instructors’ Resource Usage in Course Design
Efstratia Kolidas, University of Connecticut, Physics Major
Mentored by Dr. J.T. Laverty and Graduate Research Assistants Yohanes Dua and Subah Quidwai
How do Physics instructors plan their courses to teach? To answer that question there are multiple other follow-up questions that can guide us to an answer. What resources do they use to plan their course? What are they using those resources for? How are they using those resources? Yohanes Dua, Subah Quidwai and J.T. Laverty started on a project in answering these questions with the first step being to identify the resources that instructors use. [1] Using Interview Data from (Linda E Strubbe, Adrian M Madsen, Sarah B McKagan, and Eleanor C Sayre) and under the Organizational Learning framework (M. T. Hora and A.-B. Hunter) they identified (as of July 2026) 17 types of resources Physics instructors use to prepare for their course. [2], [3] My role in the project was to identify the usage of those resources and through qualitative analysis categorize the different types of usages and connect them back to the resources.
With the pre-cut quotes, where resources were identified, I had to look through the context of the quotes to extract a usage that was mentioned by the participant. The first step was to write descriptive information of the usages from each quote. There were 83 raw data quotes available to me and each one was analyzed by answering the question: “What is this resource used for?” and then formatting the answer as “The participant used this [resource] to do/accomplish this [task]”. This allowed [tasks] to have a repetitive nature when there were similarities between quotes analyzed. For example, “Homework, Assignments, Questions” was mentioned by my descriptive usage many times which then made it easier to narrow down to a category named “Homework”.
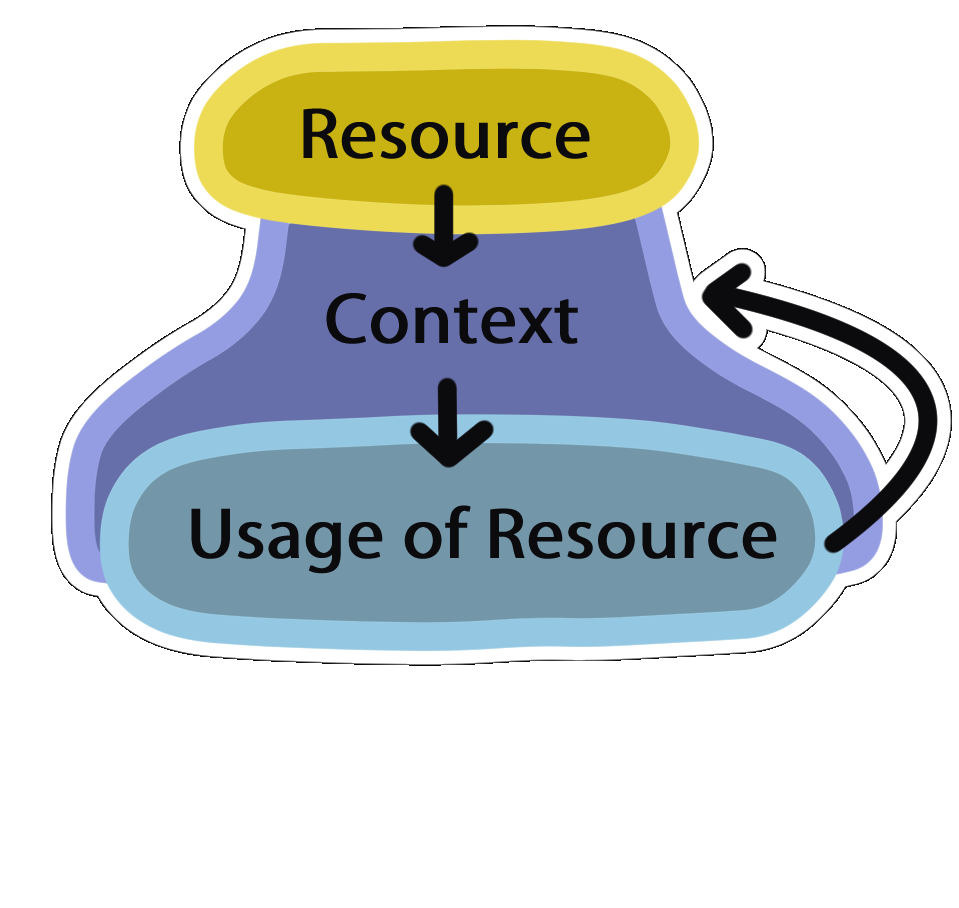
Context was required for all this work and if it wasn’t as available, then I’d need to make some assumptions about how I interpreted the data. Confidence Level was created to measure the number of assumptions made for every entry. A “10” corresponds to no assumptions made and a “1” refers to a lot of assumptions made. Through that process, lower values of Confidence Level can be revisited and decide whether they are good data to use. Anything equal and below a “6” means 40% and more of the entry is an educated guess, based on previous quotes or deductive reasoning. Following that process, with a lot of trial and error, 12 categories have been created:
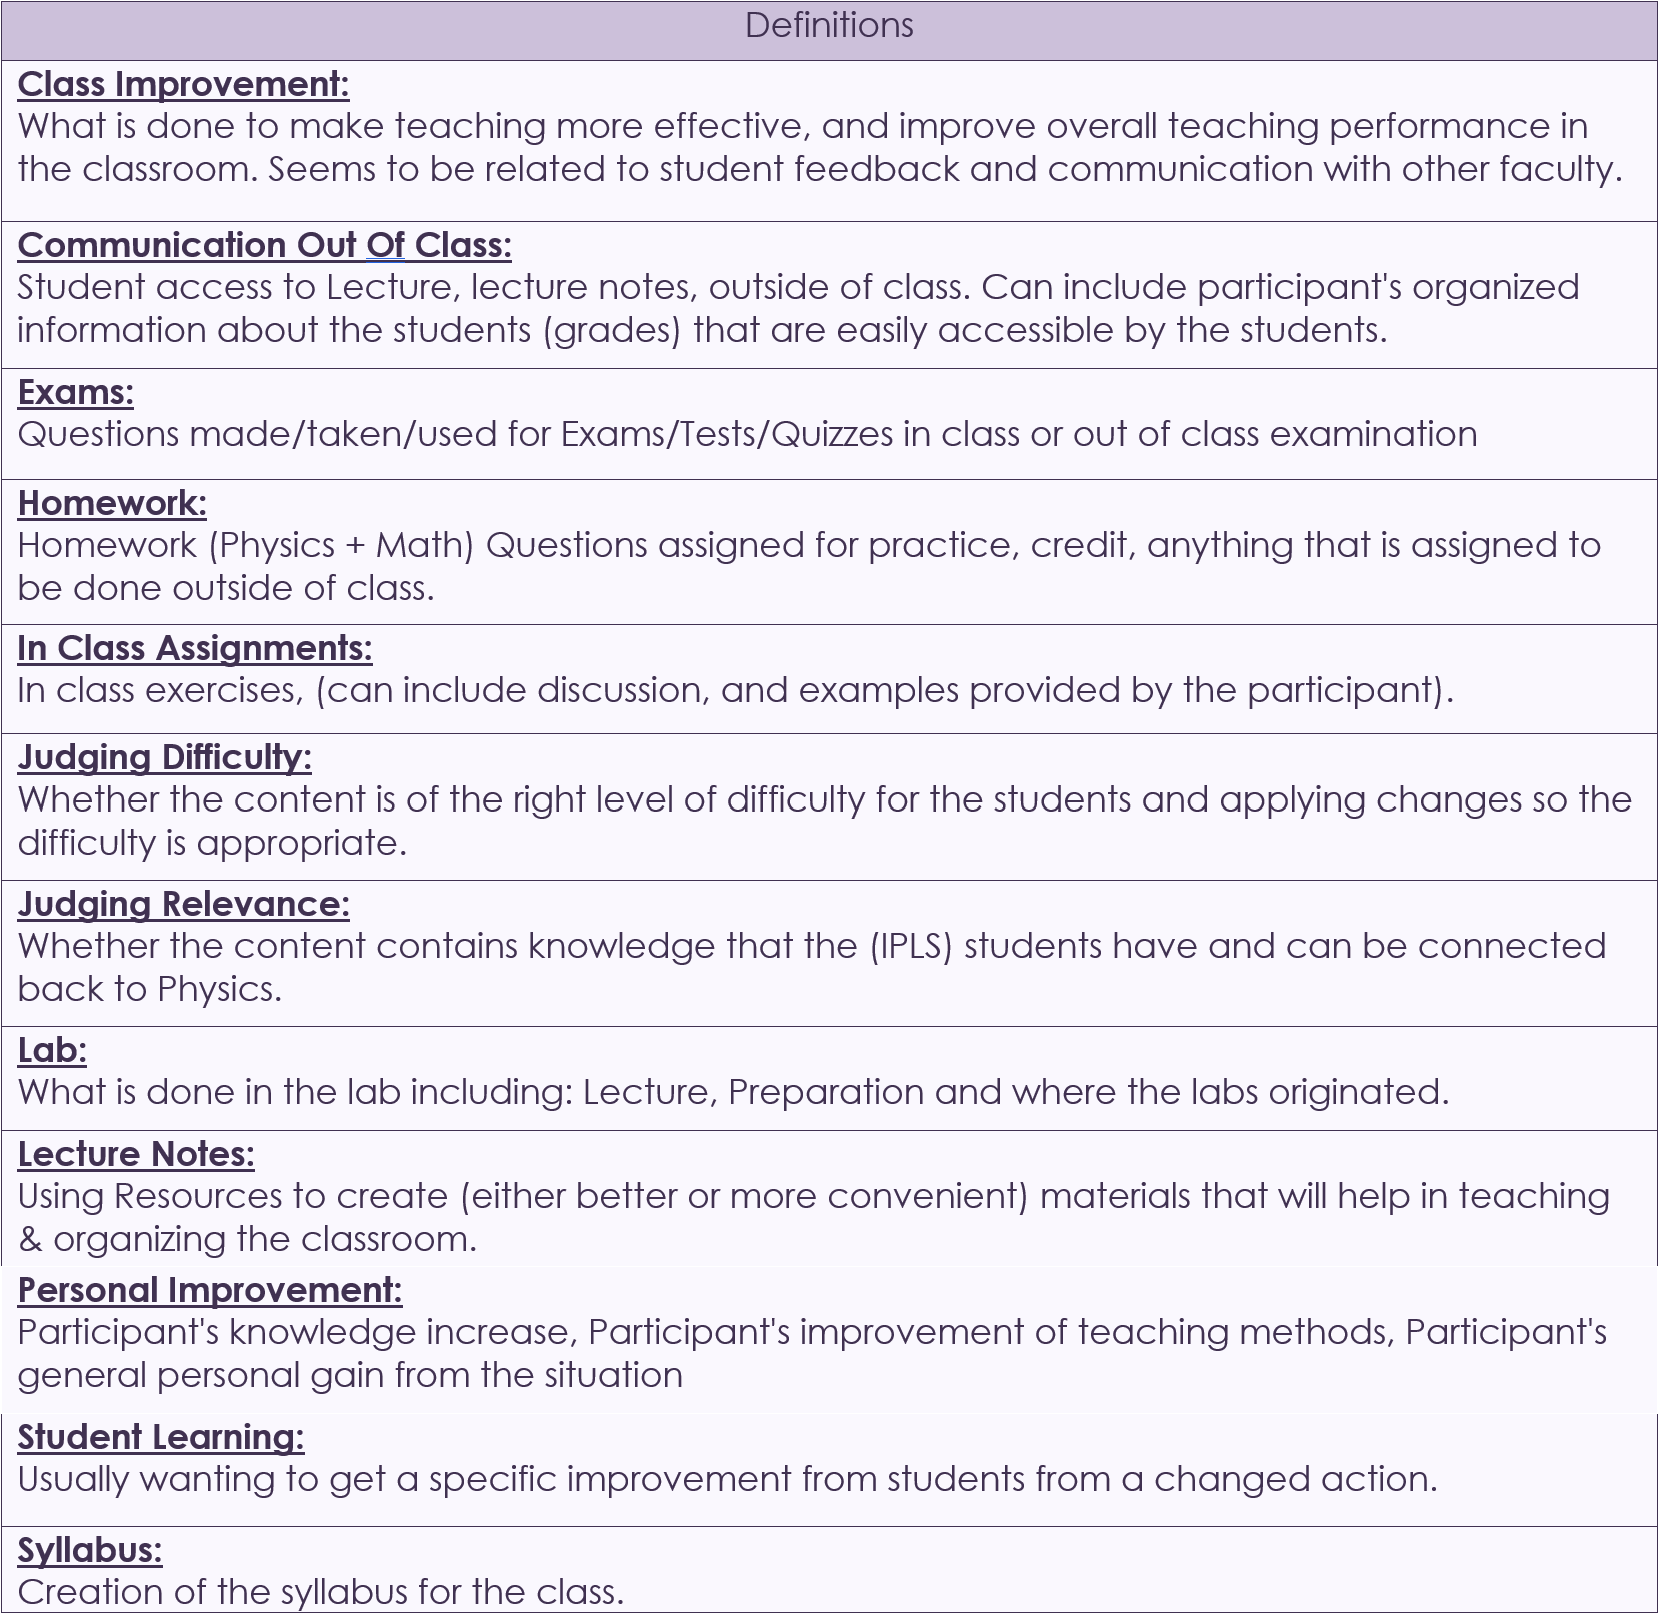
Fig. 1. Table of 12 Usage Categories and their Definitions
In total there have been 104 entries of usages, without connecting them back to their resources (which means there are no duplicates), but one quote can have multiple usages. After some quantitative analysis, of all the data extracted by the quotes, this is how the distribution looks like:
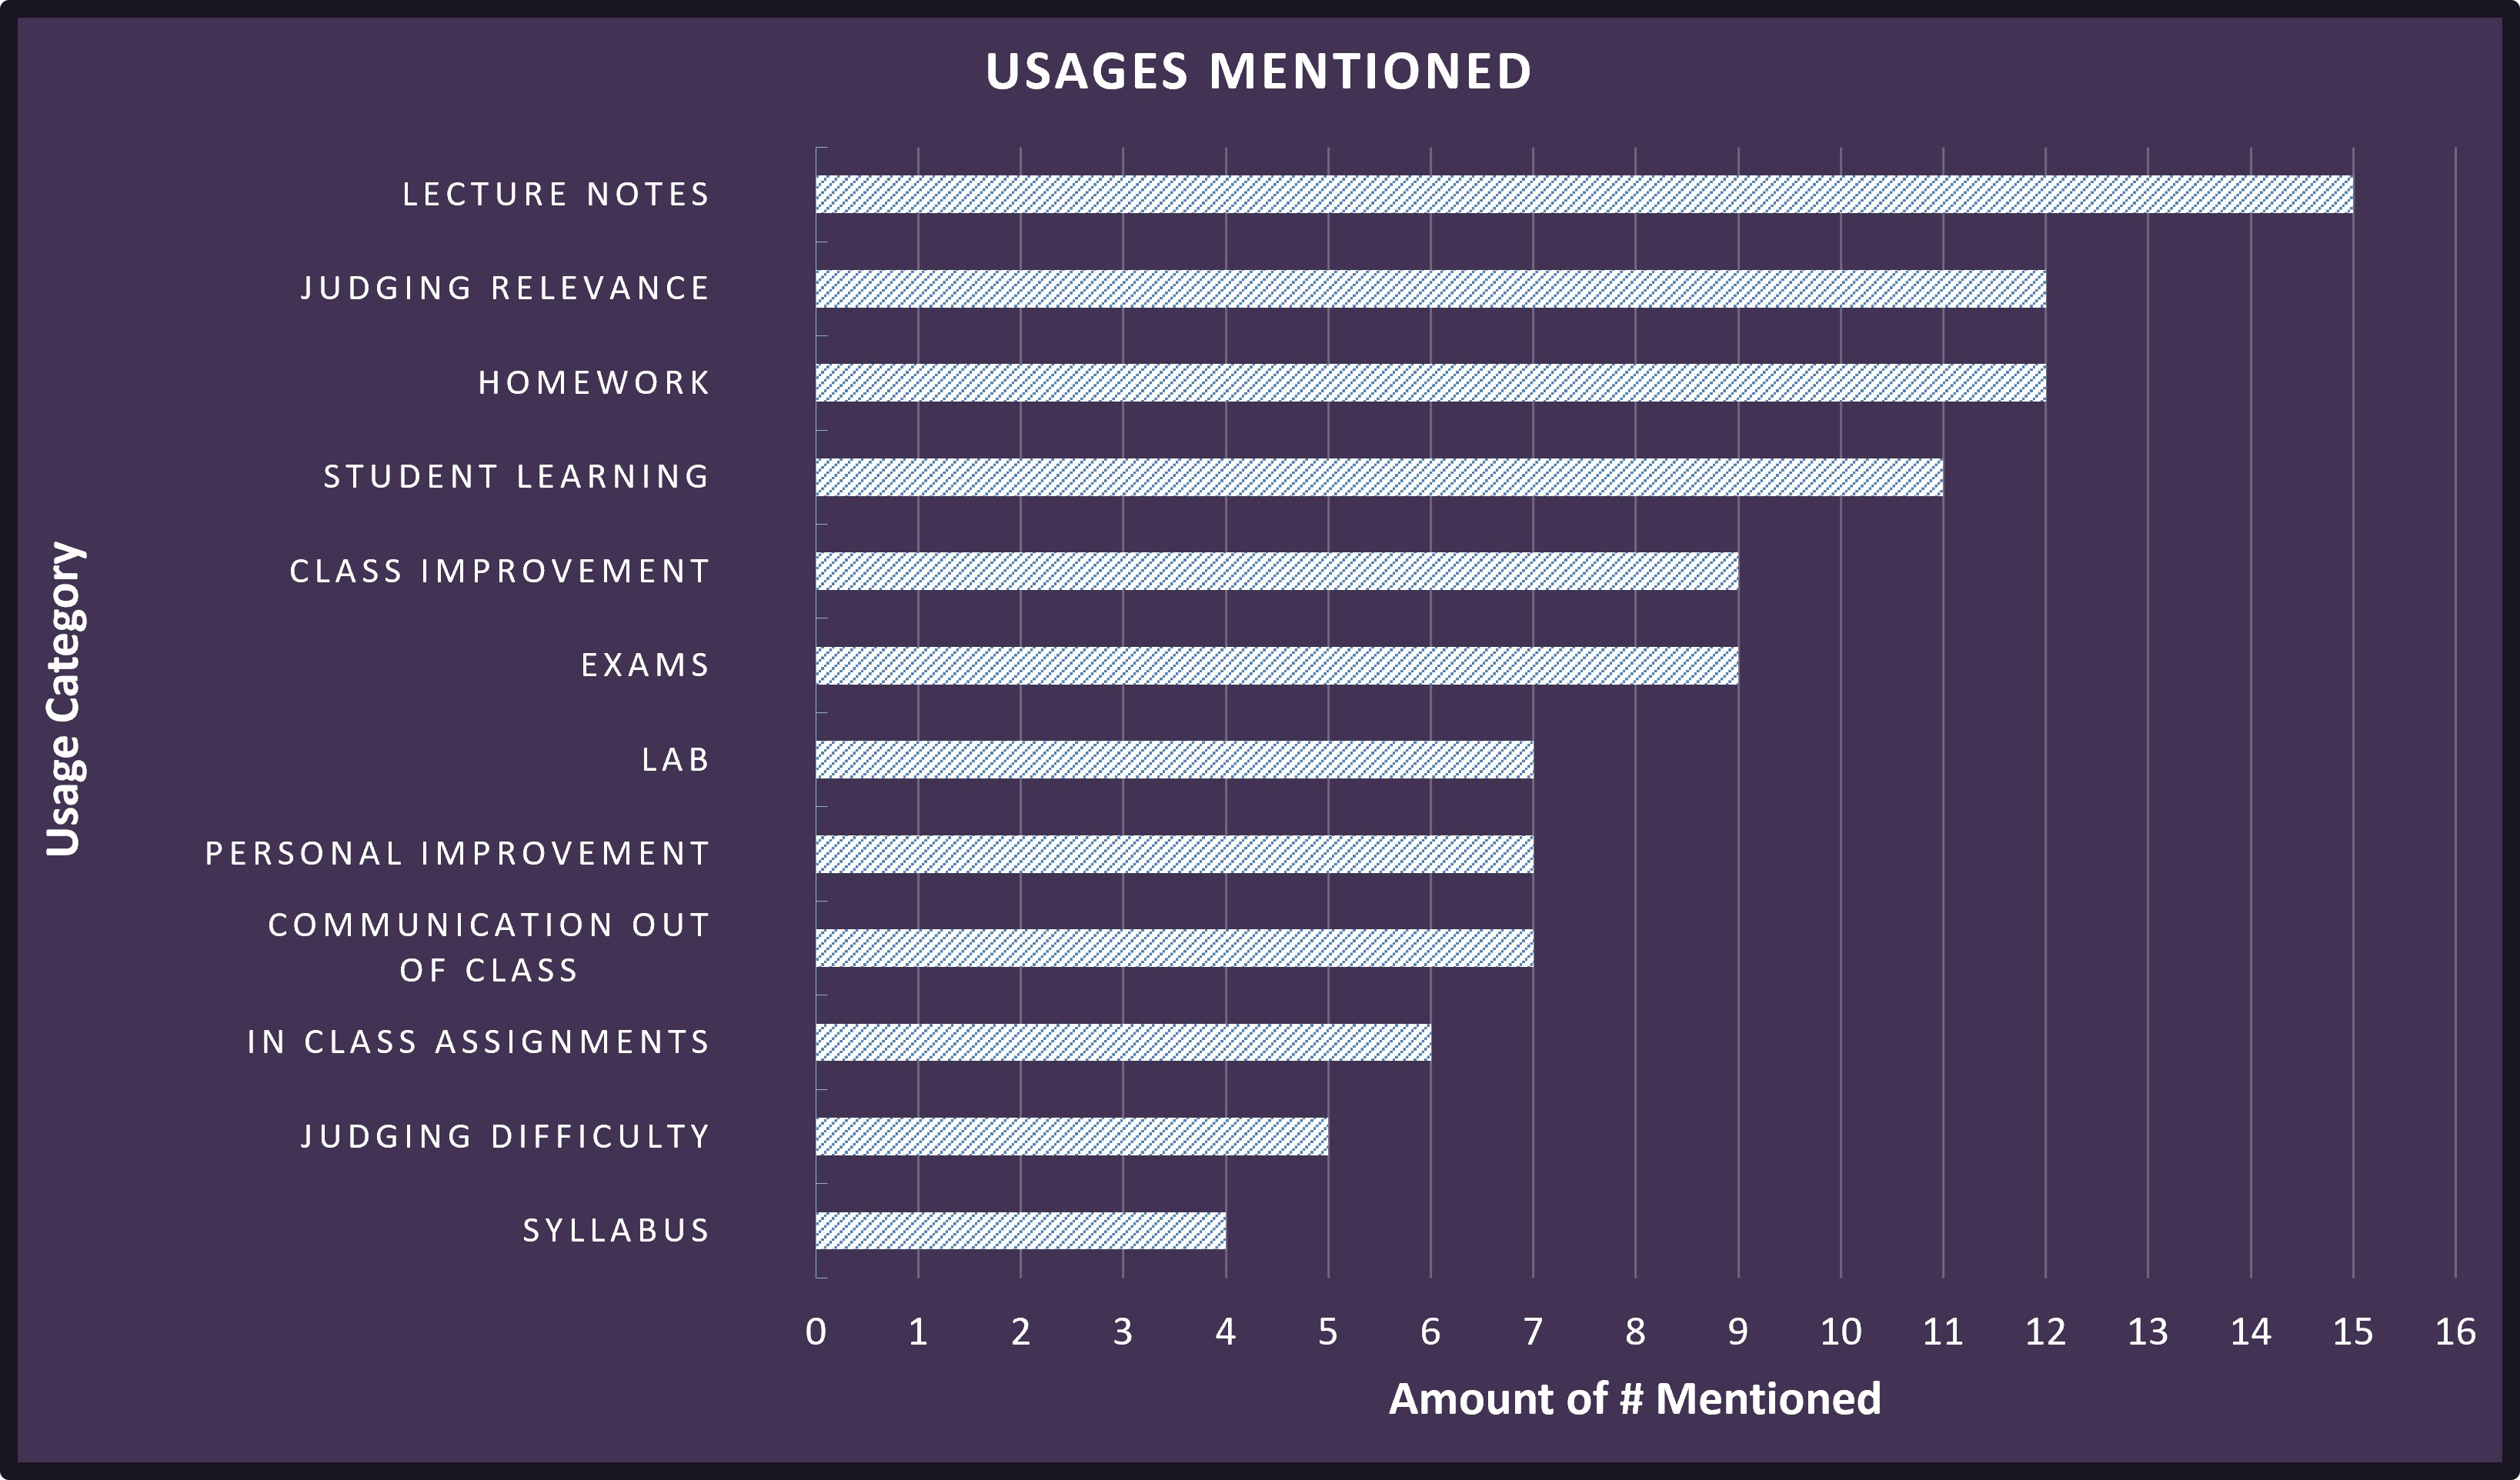
Fig. 2. Graph of the number of times each usage was mentioned in total
The tables below show more detailed information about the data analyzed:
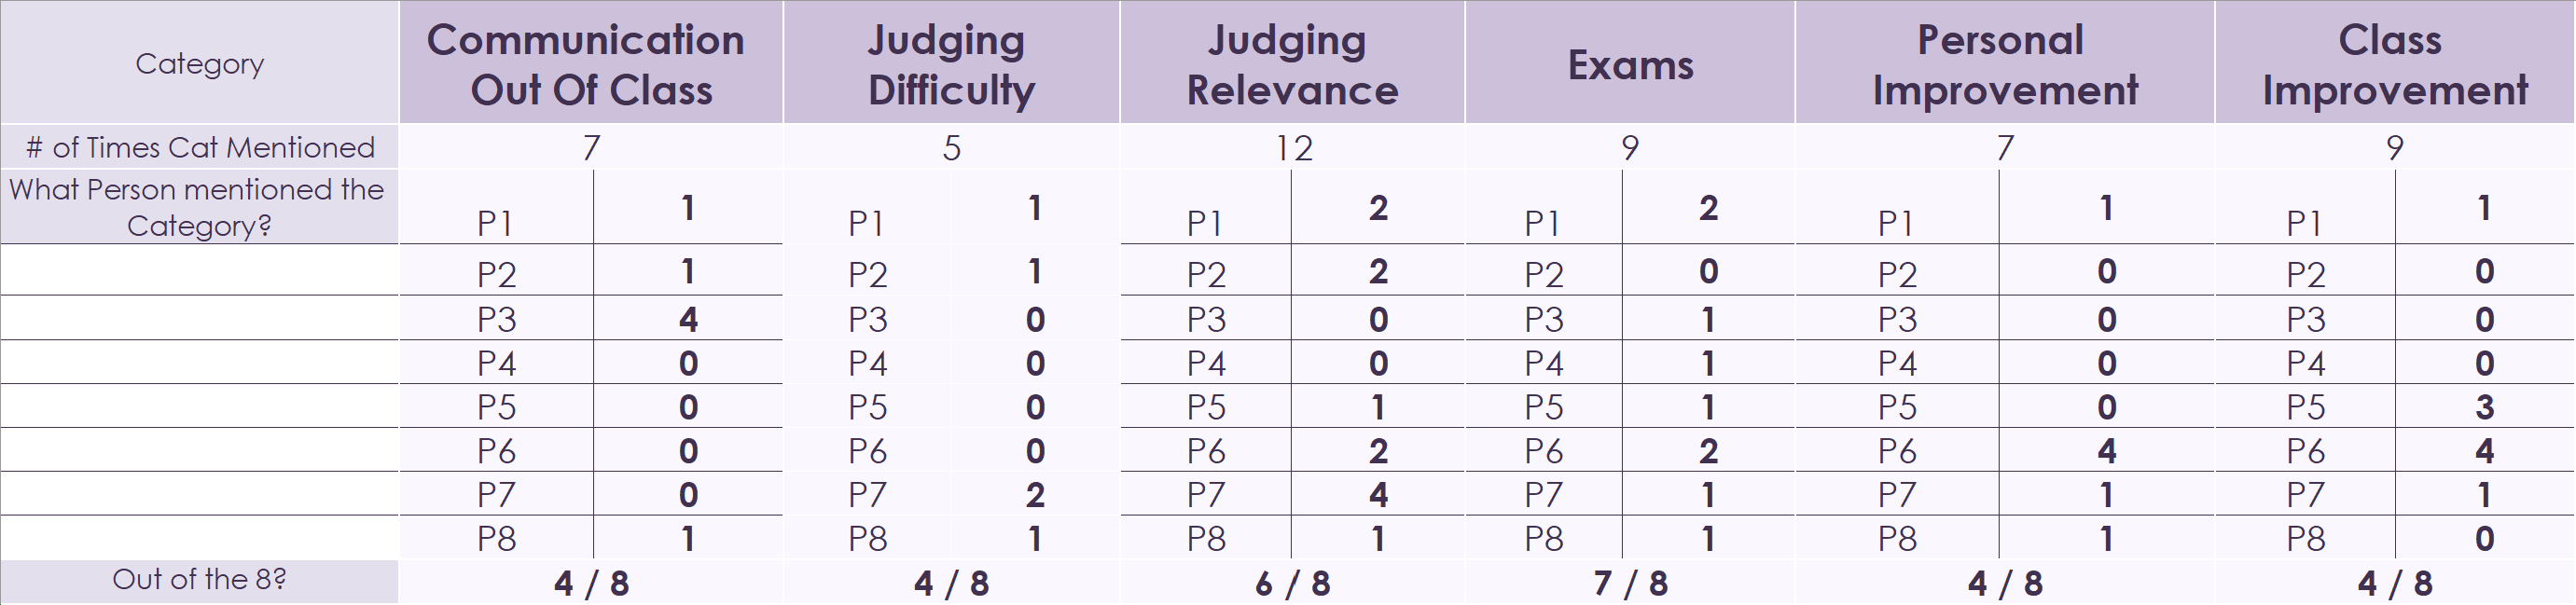
Fig, 3. Table of half the Stats of each Category
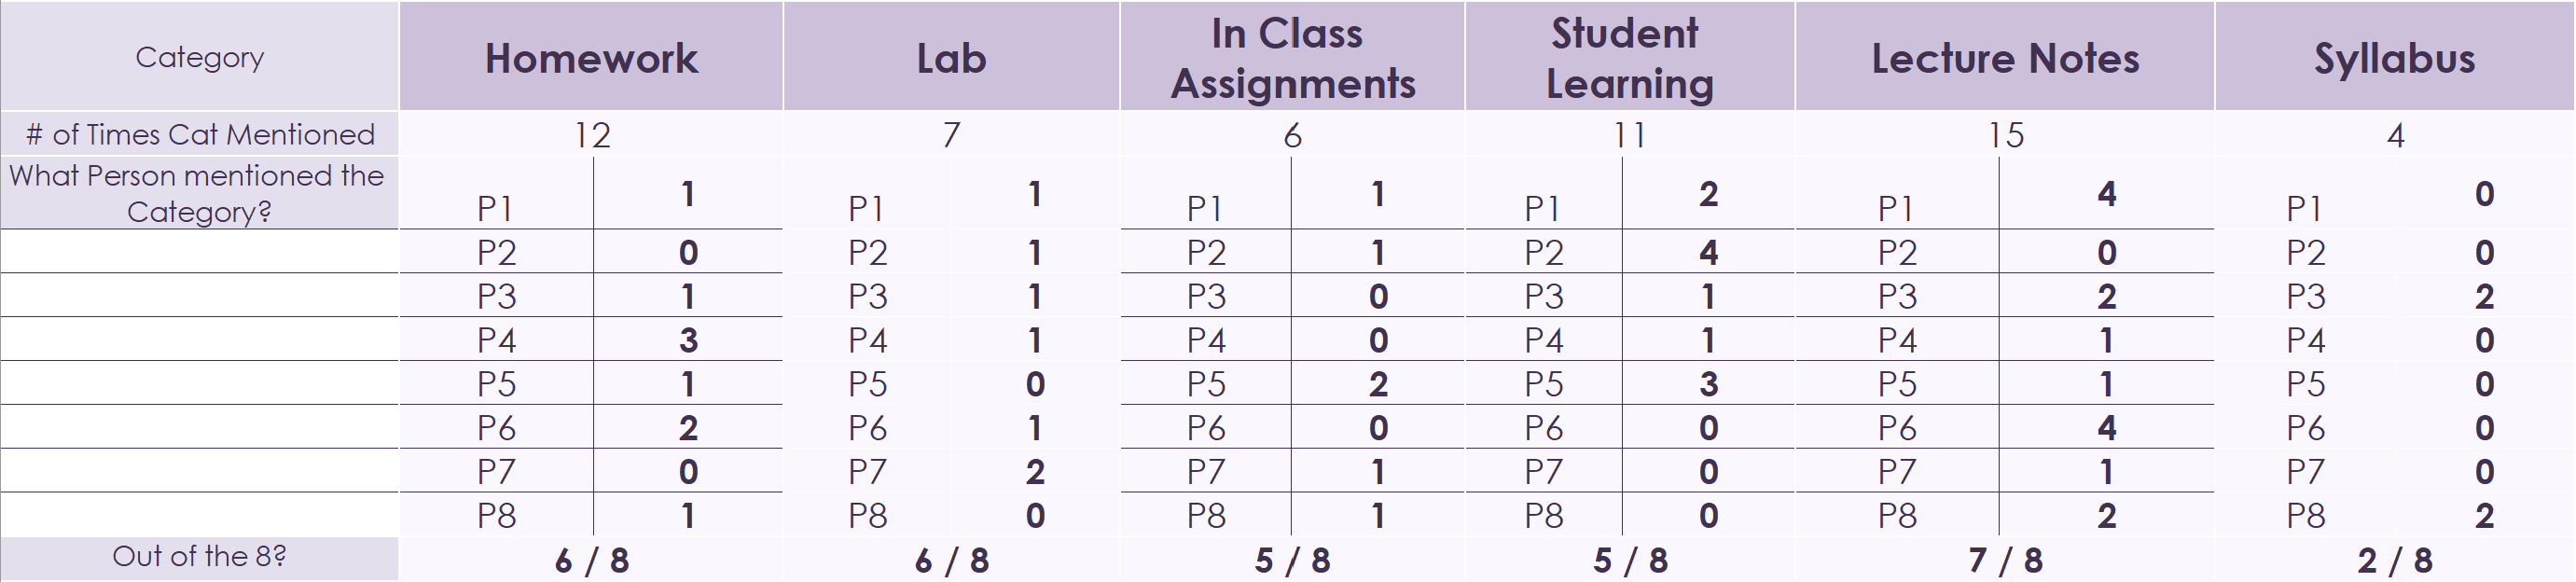
Fig. 4. Table of the other half of Stats of each Category
I also recorded how much each person contributed generally to every category:
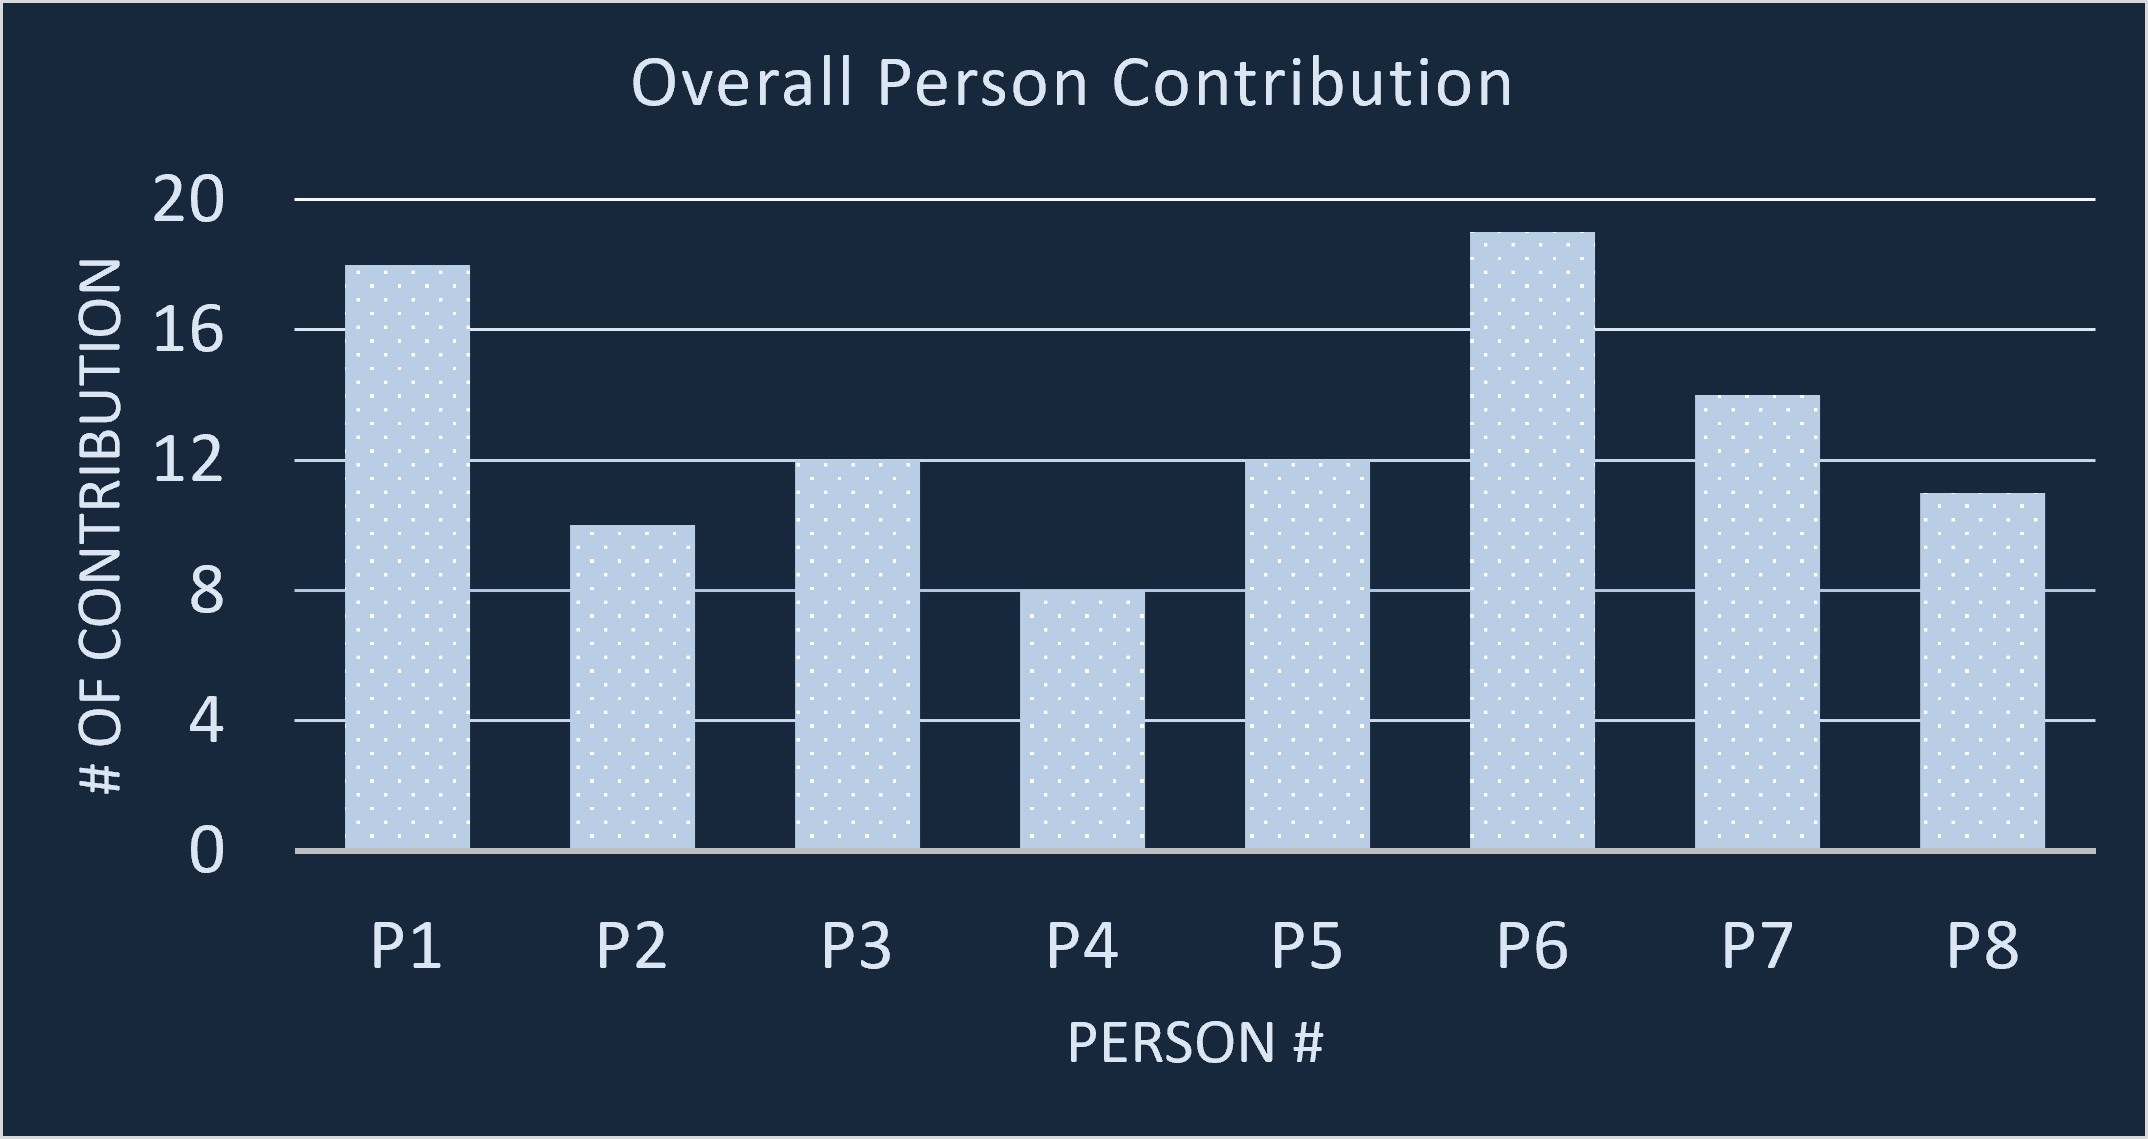
Fig. 5. Graph of Total Contribution in Usage Categories separated per person
Concluding, there are some resources that are used to produce the same (but better) resources, i.e. Exams, Homework, In Class Assignments, Lab, Lecture Notes, Syllabus. They are more focused on the result of producing curricular artifacts rather than the process. On the other hand, the other categories refer to a process: Class Improvement, Communication Out of Class, Judging Difficulty, Judging Relevance, Personal Improvement, Student Learning. These don’t describe a tangible product and need more data to be further analyzed. They are different from each other, and some are more generic than others, but nevertheless give very interesting results to this project. They bring new questions to be answered that will definitely be interesting to investigate in the future.
References
1] Y. S. Dua, J. T. Laverty, N. S. S. Quidwai, S. B. McKagan, C. Turpen, A. M. Madsen. How Do Instructors Design Courses? Investigating Resource Usage, PERC, (2026).
[2] Linda E Strubbe, Adrian M Madsen, Sarah B McKagan, and Eleanor C Sayre. Beyond teaching methods: Highlighting physics faculty’s strengths and agency. Physical Review Physics Education Research, 16(2):020105, 2020.
[3] Hora, M. T., & Hunter, A.-B. (2014). Exploring the dynamics of organizational learning: Identifying the decision chains science and math faculty use to plan and teach undergraduate courses. International Journal of STEM Education, 1(1), 8. NSF Grant DUE 1624478 & 1624185
Additional Information
The Physics instructors were from universities or community colleges and were teaching Introductory Physics for Life Sciences courses. The data was collected in 2017 using semi structured interviews.
The total number of participants was 30 but the group only analyzed 8 of them, participants who had the most detailed answers. I worked with the cut non-identifiable quotes for the entirety of the project without having access to the original transcripts.
*The “Homework” Category includes 3 additional entries that are not recorded for each person because they are math specific assignments.
Acknowledgments
I’d like to thank Yohanes for his constant feedback, fantastic cooperation, conversations and being as excited as me to see where this work will lead. I’d also like to thank J.T. for being a great (very goofy) supervisor that guided me through this project. Thank you to Subah for providing valuable feedback. To Kim, Bret and Cosmin, thank you for making this program as smooth as it was and for helping us with anything that came up. Thank you to the National Science Foundation for funding this research project. And finally thank you to the rest of the REU students for making this experience the best it could have been.
This material is based upon work supported by the National Science Foundation under Grant No. 2548403. Any opinions, findings, and conclusions or recommendations expressed in this material are those of the author(s) and do not necessarily reflect the views of the National Science Foundation.